

Are you curious about Python and its power in data analysis? Well, you’ve found the right place! Python has made a name for itself in the programming world, and its usage in data analysis is no exception. Data analysis, an integral part of today’s digital world, is made enjoyable and accessible with Python and its nifty libraries. So, let’s dive deep and unravel the world of Python libraries and their role in data analysis, together!
A Peek into Python Programming
Python, an open-source and high-level programming language, is known for its simple syntax that is easy to learn, making it popular among beginners. It’s incredibly versatile, allowing coders to create anything from simple scripts to complex machine learning algorithms!
The Imperative Role of Data Analysis
In the present digital era, data is the new oil. Effective data analysis unlocks meaningful insights, helping businesses pivot, make informed decisions, and even predict future trends. Truly, the power that data holds today is undeniable!
Why use Python for Data Analysis?
Do you wonder why Python is the go-to language in data analysis? Well, Data Analysts love Python for its simplicity and readability. It’s as beginner-friendly as it gets!
Here are the major reasons for its popularity:
- Its abundant library ecosystem
- Efficient data manipulation capabilities
- Amazing data visualization features
- More so, it’s open-source and community-supported
Popularity of Python in Data Analysis
Python has shot to fame in the world of data analysis, thanks in part to its simplicity and readability. It’s highly favored by beginners and seasoned analysts alike.
Key Strengths and Features of Python
- Versatility: Python’s vast array of libraries and packages make it an all-in-one solution for data analysis.
- Community support: Its large and active online community offers instant troubleshooting for almost any issue.
- Efficiency: Python’s coding efficiency saves a ton of time, making it a go-to for quick solution development.
NumPy: The Foundation of Python Libraries
NumPy, or Numerical Python, is like a VIP in the Python’s data analysis club. It’s the basis for a whole party of libraries!
What is NumPy?
NumPy is all about mathematical wizardry. From a simple addition to complex matrix operations, it’s your go-to buddy. It excels especially in handling large, multi-dimensional arrays and matrices. And guess what? It does that with super efficiency! That’s part of why it’s the base for many other high-level libraries.
NumPy’s Tools and Tricks
NumPy boasts of an arsenal loaded with functions such as numpy.array(), numpy.concatenate(), and operations like array addition and multiplication.
Pandas: The Swiss Army Knife for Data Manipulation
Pandas – it’s not just a cute bear, but one of Python’s most reliable data analysis libraries! Its popularity isn’t surprising when you see the control it offers.
Key Features
- Ever handled messy data? Pandas is your friend. It helps organize complex data into DataFrames – gridding your data for easy navigation.
- Time-series functionality makes date & time data trouble-free.
- Easy handling of missing data keeps your data clean and analysis accurate.
This adorable library is indeed an absolute “pandas-tic” tool for any data analyst!
It’s All About the Functions
Pandas shines with its functions like read_csv, merge, and groupby. They do heavy lifting, simplifying data reading, merging, and sorting.
Real-world Applications
Combining raw data into readable metrics is Pandas’ game. For example, a company tracking consumer trends, uses groupby to segment customer data, bringing insight from chaos.
Matplotlib: A Peek into Python’s Powerful Plotting Library
Ever had a heap of data and craved a clear, visual representation? Welcome to Matplotlib! This open-source library is as versatile as Python itself. Used primarily for static, interactive, and animated visualizations in Python, it’s a toolkit all data analysts need.
- Key Functions and Operations: It’s easy to craft 2D and 3D graphs, including histograms, power spectra, bar charts, error charts, scatter plots, etc.
- Real-World Applications: Matplotlib is popular for visualizing trends and patterns in data across many sectors, like finance and healthcare.
Meet SciPy: The Power Tool for Scientific Computing in Python
SciPy is an open-source Python library designed for science, mathematics, and engineering. With modules for optimization, linear algebra, integration, interpolation, and more, it’s a heavy-hitter in the computational world.
Key Functions and Operations
Among its numerous capabilities, SciPy excels at:
- Numerical integration
- Fourier transforms
- Optimization
- Linear algebra
- Sparse matrices
Real-World Applications of SciPy
Whether conducting weather analysis, predicting disease outbreaks, or designing winning business models, SciPy is a go-to resource for many data experts and researchers.
Seaborn: A Flavorful Enhancement for Visual Data Analysis
Are you a connoisseur of finely crafted data graphs? Seaborn might just be your next secret weapon. Seaborn is considered a statistical plotting library, with vibrant visuals that bring your data to life.
Why Seaborn?
- Stylized graphics: Seaborn makes it easy to create beautiful, expressive statistical graphics.
- Built on Matplotlib: It extends the core competent features of Matplotlib, offering a high-level interface to draw insightful pictures.
- Heat Maps: One unique feature is heat maps that visualize matrix-like data.
Seaborn in Action
In real-world applications, Seaborn shines in areas where data visualization is key. For example, researchers analyzing genetic data can use Seaborn’s cluster maps to spotlight similarities between samples. Market analysts, too, find value in Seaborn’s user-friendly APIs to present complex relationships between variables via heat maps or pair plots. In short, Seaborn helps professionals tell a compelling story with their data.
Scikit-Learn: The Powerhouse of Machine Learning
Scikit-Learn is a versatile Python library well-known for its robust machine learning algorithms. With Scikit-Learn, you can effortlessly perform complex tasks such as regression, classification, and clustering.
It’s a breeze to use. As it smoothly integrates with NumPy and SciPy, you can, most times, predict results with a single line of code. Real-world applications? Think predictive analytics, risk modeling, or sentiment analysis. Quite a powerhouse, don’t you think?
Statsmodels: The Data Scientist’s Toolbelt for Statistical Modeling
Not to be mistaken with standard statistics, statsmodels is Python’s premier library for exploring data, estimating statistical models, and running hypothesis tests. It’s the backbone for classical statistical analysis in the Python ecosystem.
Key Features
- Seeking to understand relationships between variables?
statsmodelsprovides comprehensive linear regression modeling tools. - Its time-series analysis tools are unparalleled, diving deep into patterns and sequences in your data.
- Detailed summary reports offer clear insights into the parameters and quality of your fitted models.
With statsmodels, turning raw data into actionable statistical insights becomes second nature!
It’s All About the Methods
From OLS (Ordinary Least Squares) to more advanced techniques like GLM (Generalized Linear Models) and robust linear models, statsmodels brings a plethora of methods to your fingertips. Whether it’s anova_lm for analysis of variance or Logit for logistic regression, this library has got you covered.
Real-world Applications
Ever wondered how financial analysts forecast stock market trends? Or how researchers verify the efficacy of a new drug? With tools like ARIMA for time-series forecasting and logistic regression for binary outcomes, statsmodels powers these critical decisions, transforming hypotheses into conclusions.
PySpark: Ignite Your Big Data Processing Capabilities
In the vast universe of data processing, PySpark emerges as a beacon, effortlessly handling large datasets that might daunt traditional tools. An offspring of Apache Spark, PySpark fuses the robustness of Spark with the simplicity of Python.
Key Features
- Distributed Processing: When your data grows, PySpark scales. It processes data across clusters, ensuring tasks are executed at lightning speed.
- In-Memory Computation: Bypassing the constant need to read/write from disk, PySpark performs operations in memory, boosting performance substantially.
- Resilient Distributed Datasets (RDDs): PySpark’s foundational data structure, RDDs are fault-tolerant collections that can be processed in parallel.
- DataFrame API: For those familiar with Pandas, PySpark offers a DataFrame API that provides a more structured and intuitive way to manipulate large datasets.
Harnessing the power of PySpark, diving into big data is no longer a daunting task but an exhilarating journey!
Sparkling with Functionalities
From SQL querying with SparkSQL to the machine learning capabilities of MLlib, PySpark is more than just a data processing tool. Its streaming module, Spark Streaming, lets you process real-time data, making live data analytics a reality.
Real-world Applications
Imagine processing logs from millions of users in real-time to provide instantaneous feedback or recommendations. Or analyzing vast genomes to unlock the secrets of DNA sequences. PySpark sits at the heart of these challenges, turning big data problems into insightful solutions.
With PySpark in your toolkit, the horizon of what’s possible in the realm of big data processing and analytics expands dramatically. Embrace the Spark and let your data endeavors shine!
Comparing the Libraries
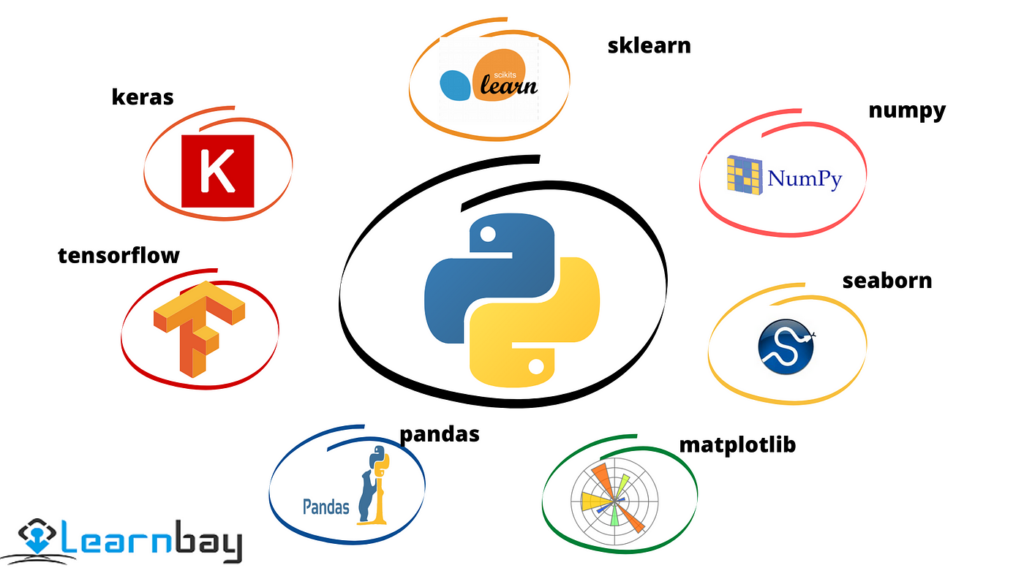
Each Python library comes with its unique strength. For instance, while NumPy excels at numerical computations, Pandas is the go-to for structured data operations. On the other hand, Matplotlib and Seaborn shine in data visualization, while SciPy and Scikit-Learn dominate scientific computing and machine learning respectively. It’s about choosing the right tool for the task you’re tackling. In the next section, we’ll delve into factors that can guide your choice.
Choosing the Right Library
Choosing the right Python library depends on the task at hand. Here are some factors:
- Complexity of Analysis: For simple tasks, Pandas might suffice. For complex mathematical operations, NumPy or SciPy is recommended.
- Data Representation: For visual data representation, consider Matplotlib or Seaborn.
- Machine Learning operations: If machine learning tasks are involved, Scikit-Learn is your go-to library.
In summary, each library has its own unique strengths. Choose according to your specific needs.
Conclusion
Well, that’s a wrap! We made it through some of the most popular Python libraries for data analysis. From the versatility of NumPy & Pandas, aesthetics of Seaborn, to the advanced computations of SciPy and Scikit-Learn, Python has got something for everyone in data analysis. Remember, the best tool depends entirely on your unique project needs. Experiment, explore, and let Python’s libraries help uncover the stories hidden in your data.
References
For deeper insights into these robust Python libraries, feel free to check out the following resources:
- NumPy: Visit the official documentation.
- Pandas: Here’s the user guide.
- Matplotlib: Dabble in data visualization with this tutorial.
- SciPy: The SciPy lecture notes cover everything.
- Seaborn: Master statistical graphics here.
- Scikit-Learn: Start your machine learning journey with this guide.