
In this post, I want to share a cool project I recently did as part of the Data Engineering module of my PDEng program. I will show how to do simple twitter sentiment analysis in Python with streaming data from Twitter.
The data is streamed into Apache Kafka, then stored in a MongoDB database, and finally, the results are presented in a dashboard made with Dash and Plotly.
I hope you are excited. Let’s dive into it!
Caveat: This tutorial/demonstration is quite advanced, so if you are new to Python and Data Science/Data Engineering, it may be a bit tough to follow and replicate. I provide all the code on GitHub (additional instructions about the code can be found on the Repository’s readme) and try to explain the steps needed. However, some familiarity with Apache Kafka, Python, MongoDB, and Dash/Plotly is preferred to be able to follow along and replicate what I did. Different technologies are involved and I cannot give a detailed tutorial in all of them in just this blog post. 🙂
Code on ==> GitHub
Twitter Sentiment Analysis Using Python
The point of the dashboard was to inform Dutch municipalities on the way people feel about the energy transition in The Netherlands. The government wants to terminate the gas-drilling in Groningen and asked the municipalities to make the neighborhoods gas-free by installing solar panels.
However, it is possible that people are not in line with this decision. We began with the assumption that people share their opinions and feelings on social media platforms.
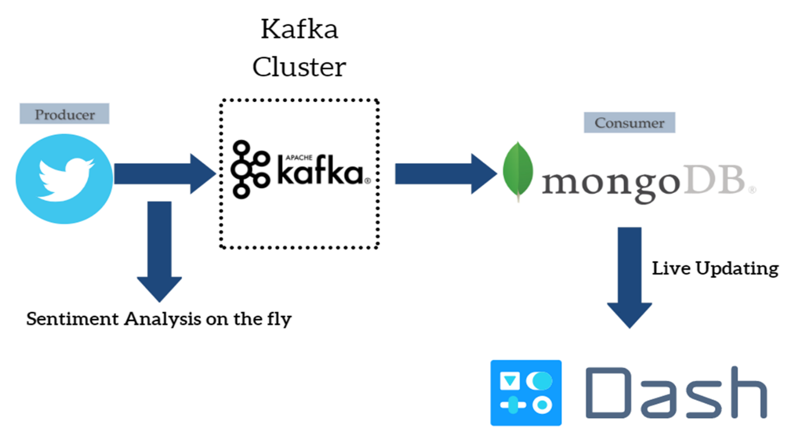
For the purpose of this project, we focused on Twitter. Here, the data pipeline that we put in place can be seen.

Data Pipeline Overview
The central part of the data pipeline is the Apache Kafka cluster. The Apache Kafka cluster can be used for streaming data and also for integrating different data sources and different applications.
In our case, data from Twitter is pushed to the Apache Kafka cluster. Additionally, sentiment analysis is performed on the text of the tweets before the data is pushed to the cluster. This part is called a Twitter producer in terms of Kafka terminology.
On the other side, there exists a consumer that subscribes to the Apache Kafka topic and stores the JSON objects of the tweets to a MongoDB database. Finally, the results are presented in an interactive dashboard that is updated live using Dash and Plotly. Following comes a more detailed explanation of the different parts of the pipeline.
Apache Kafka Cluster
Things were kept simple here. The cluster has only 1 topic with 6 partitions and a replication factor of 1 (we only deployed locally so there was no need for distributed processing).
Twitter Producer
The Twitter Producer is written in Python and makes use of the Twitter Streaming API. Three primary Python modules were used, namely pykafka for the connection with the Apache Kafka cluster, tweepy for the connection with the Twitter Streaming API, and textblob for the sentiment analysis.
The producer fetches tweets based on a specified list of keywords. The keywords that were used for this project can be seen below. The commas between the keywords work as logical OR and the space in each keyword phrase as logical AND.

Moreover, the fields that the producer is fetching from the tweets’ JSON objects are presented in the following table.
Fields Fetched by the Twitter Producer
| creation_datetime | The date and time that the tweet was created |
| favorites | The total number of favorites the tweet has received |
| followers | The total number of followers the user who tweeted has |
| location | The location where the tweet happened |
| retweets | The total number of times that the tweet has been retweeted |
| senti_val | The sentiment score that was given by the TextBlob module algorithm (more on this later) |
| subjectivity | The subjectivity score that was given by the TextBlob module algorithm (more on this later) |
| text | The full text of the tweet |
| user_description | The description that the users provide about themselves on their profiles |
| username | The username of the user who tweeted |
Finally, the fetched JSON objects are published to the Apache Kafka cluster.
Sentiment Analysis
The Sentiment Analysis is performed while the tweets are streaming from Twitter to the Apache Kafka cluster. The analysis is done using the textblob module in Python.
Because the module does not work with the Dutch language, we used the following approach. First, we detect the language of the tweet. Next, if the language is Dutch we translate the tweet to English using the Google Translate API.
Finally, we perform the sentiment analysis on the translated text. If the text is already in English we, of course, perform the sentiment analysis right away. The algorithm can be seen below.
The fields that are created from the sentiment analysis are the sentiment score and the subjectivity score. The sentiment score ranges from -1 to +1.
The closer to -1 means that the tweet is classified as negative, the closer to +1 means that the tweet is classified as positive. The subjectivity value ranges from 0 to +1.
The closer the value is to +1 means that the tweet is subjective, the closer to 0 means that the tweet is objective.
MongoDB Consumer
The MongoDB Consumer is also written in Python. The consumer uses the pymongo module to connect with the desired collection of the MongoDB database.
At the same time, it subscribes to the desired Apache Kafka topic. After the connections are established, it stores the JSON objects from the Apache Kafka topic to the MongoDB database.

The need for such a consumer is that Apache Kafka is not a database. The data is lost after some days pass. For that reason, we have to store them in the MongoDB database for future use.
Finally, a NoSQL database such as MongoDB was chosen because it is made for working with JSON objects. Moreover, it provides flexibility in adding or subtracting fields we would like to fetch from Twitter in the future.
Streaming Dashboard
Finally, the results are shown in an interactive dashboard made using the Dash-Plotly framework in Python. It makes use of Live Updates to update the data that is shown to the user every 5 seconds (the interval can be specified).
The overall structure of the dashboard can be seen below.

There are four sections in the dashboard. Each one will be discussed in more detail.
Section 1 of the Sentiment Analysis Dashboard
Section 1 of the dashboard shows a table with the 5 most recent tweets that happened about the energy transition. Additionally, the date and time of the tweet are shown, as well as the sentiment and subjectivity scores that were explained previously.
The tweets are updated in real-time as they are fetched from Twitter. Naturally, at the moment tweets that are not relevant are also fetched by the data pipeline.

Section 2 of the Dashboard
Section 2 showcases a vertical bar chart with the users that were most active in tweeting about the energy transition. Furthermore, if the dashboard user hovers over the bars, the description of the twitter user will pop up, if it was available in the data.

Section 3 of the Dashboard
Section 3 showcases a horizontal bar chart with the number of tweets that happened per day related to the energy transition. Some bars are zero only because the dashboard was not running on our laptop these days.
In order to get full data, the dashboard should be deployed on a server and run 24/7 (Heroku is one possible option, as well as Google Cloud, to name some ideas).
Section 4 of the Dashboard
Finally, section 4 of the Dashboard showcases a donut chart that informs on the total percentages of positive, negative, and neutral tweets fetched by the data pipeline.

Interesting Tweets Were Fetched
To conclude, while working with the dashboard we came upon several interesting examples of tweets. For example, below you can see two of those interesting tweets.
In the first, the user is wondering how the Dutch government will end the Groningen gas extraction. In the second, another user is wondering about the cost of making houses ‘carbon zero’.
Thus, there seems that indeed discussion is happening about the energy transition in The Netherlands on Twitter.

Thanks for Reading
Thank you for following through this post and I hope you found the project interesting. In case you were overwhelmed realize it is completely fine because many different technologies are involved and this post is not really a detailed tutorial.
If you would like to use the code feel free to do so, though I would appreciate a star and fork on GitHub :). In case you find any mistakes in the post and/or code I would be very happy to hear them out.
If you have any comments or questions I would love to read them below.
Also, be sure to follow me on social media (links in the sidebar) or contact me directly here.
Cheers,
Antonios
First of all, I must commend your efforts for this informative tutorial. You’ve done a great job I must say, but I have a favor to ask, can you please make a more simplified version of it with more details on each step? Twitter sentiment analysis is super interesting but I’d appreciate it better if I was able to understand the basics for each technology used. I’m really hoping to get a reply from you, thanks.
Hello and thanks for the comment. It would actually take a series of many blog posts to cover tutorials for each of the technology stacks used in this blog post. One I have in mind already is a tutorial on Plotly and Dash. You can find the code for this tutorial already on this Github. Apart from that, I can recommend searching for beginner tutorials online. I’m sure you can find many. Also, websites like Udemy, Coursera, edX, and Udacity, among others, have wonderful courses, many of which are free or very cheap. It’s like having a University education at your laptop these days! 🙂
To be honest when I started reading the post I didn’t understand it, but the more I read, it got my attention. Makes me want to learn more about coding and data science. On your analysis of Twitter tweets, there is a lot of interesting information you present and the way you get to the outcome was something I enjoyed. Thank you!
Thanks for your comment and happy that it was helpful and motivated you to learn more about coding and data science/engineering! It’s ok to not understand parts right away. The project was quite complex, especially for a beginner. 😉